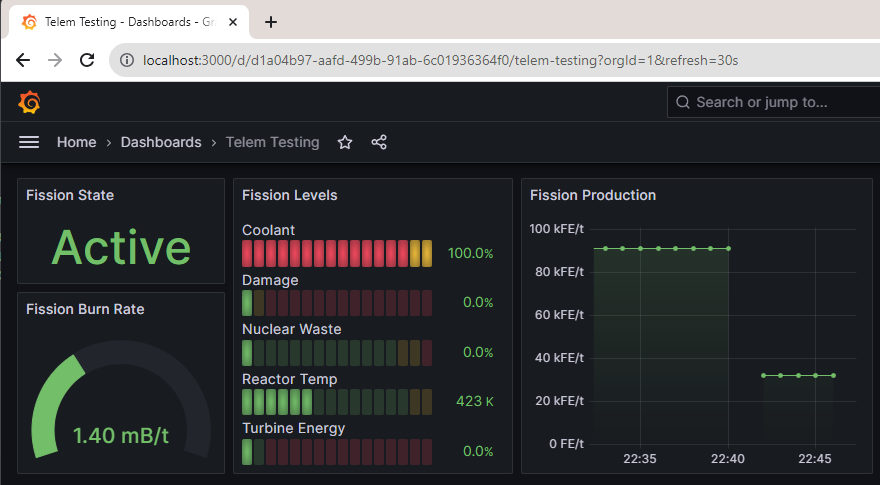
Grafana Output advanced Source
telem.output.grafana (endpoint: string, apiKey: string)Advanced Connector
This adapter documentation is intended for those already familiar with many Telem concepts. If you are not familiar with Telem code, it is recommended to run through the Getting Started examples first.
Pushes metrics to a Grafana instance. adapter, source, and unit are implemented as labels.
Grafana Cloud
INFO
This guide assumes you already have a Grafana Cloud account ready to go. If not, get one here: https://grafana.com/
- Log into your Grafana Cloud instance.
- Go to the URL below (replace
instancenamewith your instance name):Follow the steps to generate your API key and endpoint at the end of Step 4:https://instancename.grafana.net/connections/add-new-connection/http-metrics
- In your script, add your authentication information (
authGrafana) and provide totelem.output.grafana:lualocal telem = require 'telem' local authGrafana = { endpoint = 'https://influx-prod-xyz.grafana.net/api/v1/push/influx/write', apiKey = '10xxx:glc_eyzzz' } local backplane = telem.backplane() :addInput('fission', telem.input.mekanism.fissionReactor('fissionReactorLogicAdapter_1')) :addInput('turbine', telem.input.mekanism.industrialTurbine('turbineValve_1')) :addOutput('grafana', telem.output.grafana(authGrafana.endpoint, authGrafana.apiKey)) -- push to Grafana every 30 seconds parallel.waitForAny( backplane:cycleEvery(30) ) - Start the script. It may take a few minutes for metrics to start appearing in your instance. You can check status using Metrics explorer, eventually you will see metrics start to trickle in. Then, you can add panels and write queries, using adapters and sources for filtering and aggregation.
Self-Hosted (Docker)
If you are looking to manage a Grafana instance locally, or host one on a server, this guide outlines a methodology using Docker Compose.

In your working directory of choice, create the following files:
version: "3.8"
services:
  grafana:
    image: grafana/grafana-oss
    container_name: grafana
    ports:
      - "3000:3000"
    volumes:
      - grafana_storage:/var/lib/grafana
      - ./grafana-provisioning/:/etc/grafana/provisioning
    depends_on:
      - influxdb
    environment:
      - GF_SECURITY_ADMIN_USER=${GRAFANA_USERNAME}
      - GF_SECURITY_ADMIN_PASSWORD=${GRAFANA_PASSWORD}
    networks:
      - grafana
  influxdb:
    image: influxdb:latest
    container_name: influxdb
    ports:
      - '3001:8086'
    volumes:
      - influxdb_storage:/var/lib/influxdb
    environment:
      - DOCKER_INFLUXDB_INIT_MODE=setup
      - DOCKER_INFLUXDB_INIT_USERNAME=${INFLUXDB_USERNAME}
      - DOCKER_INFLUXDB_INIT_PASSWORD=${INFLUXDB_PASSWORD}
      - DOCKER_INFLUXDB_INIT_ORG=${INFLUXDB_ORG}
      - DOCKER_INFLUXDB_INIT_BUCKET=${INFLUXDB_BUCKET}
      - DOCKER_INFLUXDB_INIT_ADMIN_TOKEN=${INFLUXDB_TOKEN}
    networks:
      - grafana
  chronograf:
    image: chronograf:latest
    ports:
      - '3002:8888'
    volumes:
      - chronograf-storage:/var/lib/chronograf
    depends_on:
      - influxdb
    environment:
      - INFLUXDB_URL=http://influxdb:8086
      - INFLUXDB_USERNAME=${INFLUXDB_USERNAME}
      - INFLUXDB_PASSWORD=${INFLUXDB_PASSWORD}
    networks:
      - grafana
  telegraf:
    image: telegraf:latest
    container_name: telegraf
    ports:
      - '3003:8080'
    volumes:
      - ./telegraf/telegraf.conf:/etc/telegraf/telegraf.conf:ro
    environment:
      - DOCKER_INFLUXDB_INIT_ORG=${INFLUXDB_ORG}
      - DOCKER_INFLUXDB_INIT_BUCKET=${INFLUXDB_BUCKET}
      - DOCKER_INFLUXDB_INIT_ADMIN_TOKEN=${INFLUXDB_TOKEN}
    networks:
      - grafana

networks:
  grafana:
volumes:
  grafana_storage:
  influxdb_storage:
  chronograf-storage:
INFLUXDB_USERNAME=admin
INFLUXDB_PASSWORD=password123
INFLUXDB_ORG=org0
INFLUXDB_BUCKET=bucket0
INFLUXDB_TOKEN=use_a_random_token
GRAFANA_USERNAME=admin
GRAFANA_PASSWORD=password123# Output Configuration for telegraf agent
[[outputs.influxdb_v2]]
## The URLs of the InfluxDB cluster nodes.
##
## Multiple URLs can be specified for a single cluster, only ONE of the
## urls will be written to each interval.
## urls exp: http://127.0.0.1:8086
urls = ["http://influxdb:8086"]
## Token for authentication.
token = "$DOCKER_INFLUXDB_INIT_ADMIN_TOKEN"
## Organization is the name of the organization you wish to write to; must exist.
organization = "$DOCKER_INFLUXDB_INIT_ORG"
## Destination bucket to write into.
bucket = "$DOCKER_INFLUXDB_INIT_BUCKET"
insecure_skip_verify = true
# Generic HTTP write listener
[[inputs.http_listener_v2]]
## Address and port to host HTTP listener on
service_address = ":8080"
## Paths to listen to.
paths = ["/telegraf"]
## Save path as http_listener_v2_path tag if set to true
# path_tag = false
## HTTP methods to accept.
# methods = ["POST", "PUT"]
## maximum duration before timing out read of the request
read_timeout = "60s"
## maximum duration before timing out write of the response
write_timeout = "60s"
## Maximum allowed http request body size in bytes.
## 0 means to use the default of 524,288,000 bytes (500 mebibytes)
# max_body_size = "500MB"
## Part of the request to consume. Available options are "body" and
## "query".
data_source = "body"
## Set one or more allowed client CA certificate file names to
## enable mutually authenticated TLS connections
# tls_allowed_cacerts = ["/etc/telegraf/clientca.pem"]
## Add service certificate and key
# tls_cert = "/etc/telegraf/cert.pem"
# tls_key = "/etc/telegraf/key.pem"
## Optional username and password to accept for HTTP basic authentication.
## You probably want to make sure you have TLS configured above for this.
# basic_username = "foobar"
# basic_password = "barfoo"
## Optional setting to map http headers into tags
## If the http header is not present on the request, no corresponding tag will be added
## If multiple instances of the http header are present, only the first value will be used
# http_header_tags = {"HTTP_HEADER" = "TAG_NAME"}
## Data format to consume.
## Each data format has its own unique set of configuration options, read
## more about them here:
## https://github.com/influxdata/telegraf/blob/master/docs/DATA_FORMATS_INPUT.md
data_format = "influx"Launch the stack with docker compose up. This will start Grafana, InfluxDB, Chronograf, and Telegraf. By default, the links below will be available:
- Grafana: http://localhost:3000
- InfluxDB: http://localhost:3001
- Chronograf: http://localhost:3002
- Telegraf (Telem push endpoint): http://localhost:3003/telegraf
Grafana Setup
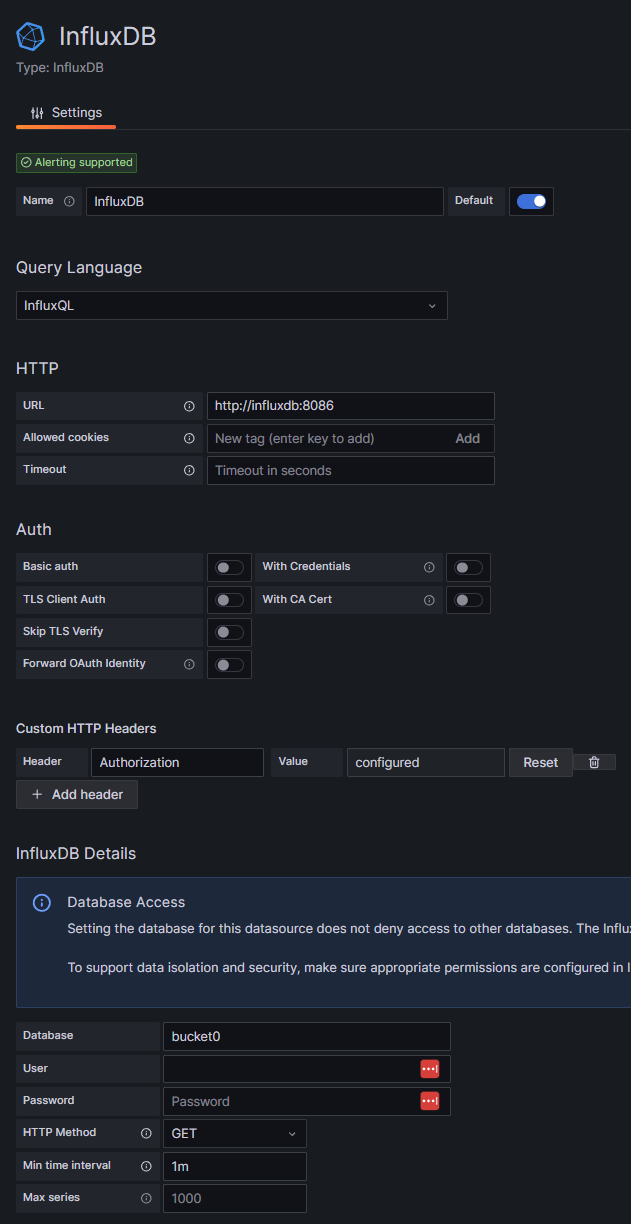
In Grafana, add an InfluxDB data source with the following settings:
- Query Language: InfluxQL
- URL:
http://influxdb:8086 - Custom HTTP Headers:
- Authorization:
Token INFLUXDB_TOKEN(replaceINFLUXDB_TOKENwith your random token from the.envfile)
- Authorization:
- Database:
INFLUXDB_BUCKETfrom the.envfile - HTTP Method: GET
- Min time interval:
1m(optional, but recommended)

Telem Setup
- Endpoint: http://localhost:3003/telegraf (or your own domain/port as appropriate)
- Token:
""(this guide does not set up push authentication; use a long token-like path in the Telegraf config if you need to protect it)
Query Builder Overview
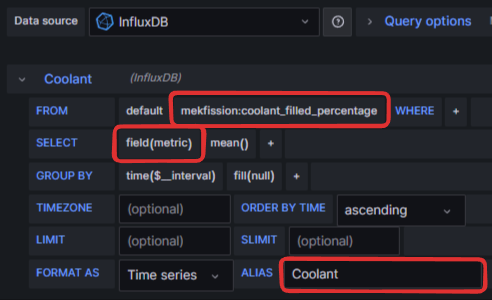
- Click "select measurement" to search and pick a metric. Note that only active metrics appear in this list.
- Click "field(value)" on the word "value" and select "metric"
- Optionally, enter text in the ALIAS textbox to rename a specific metric in the legend

Sample Grafana Dashboards
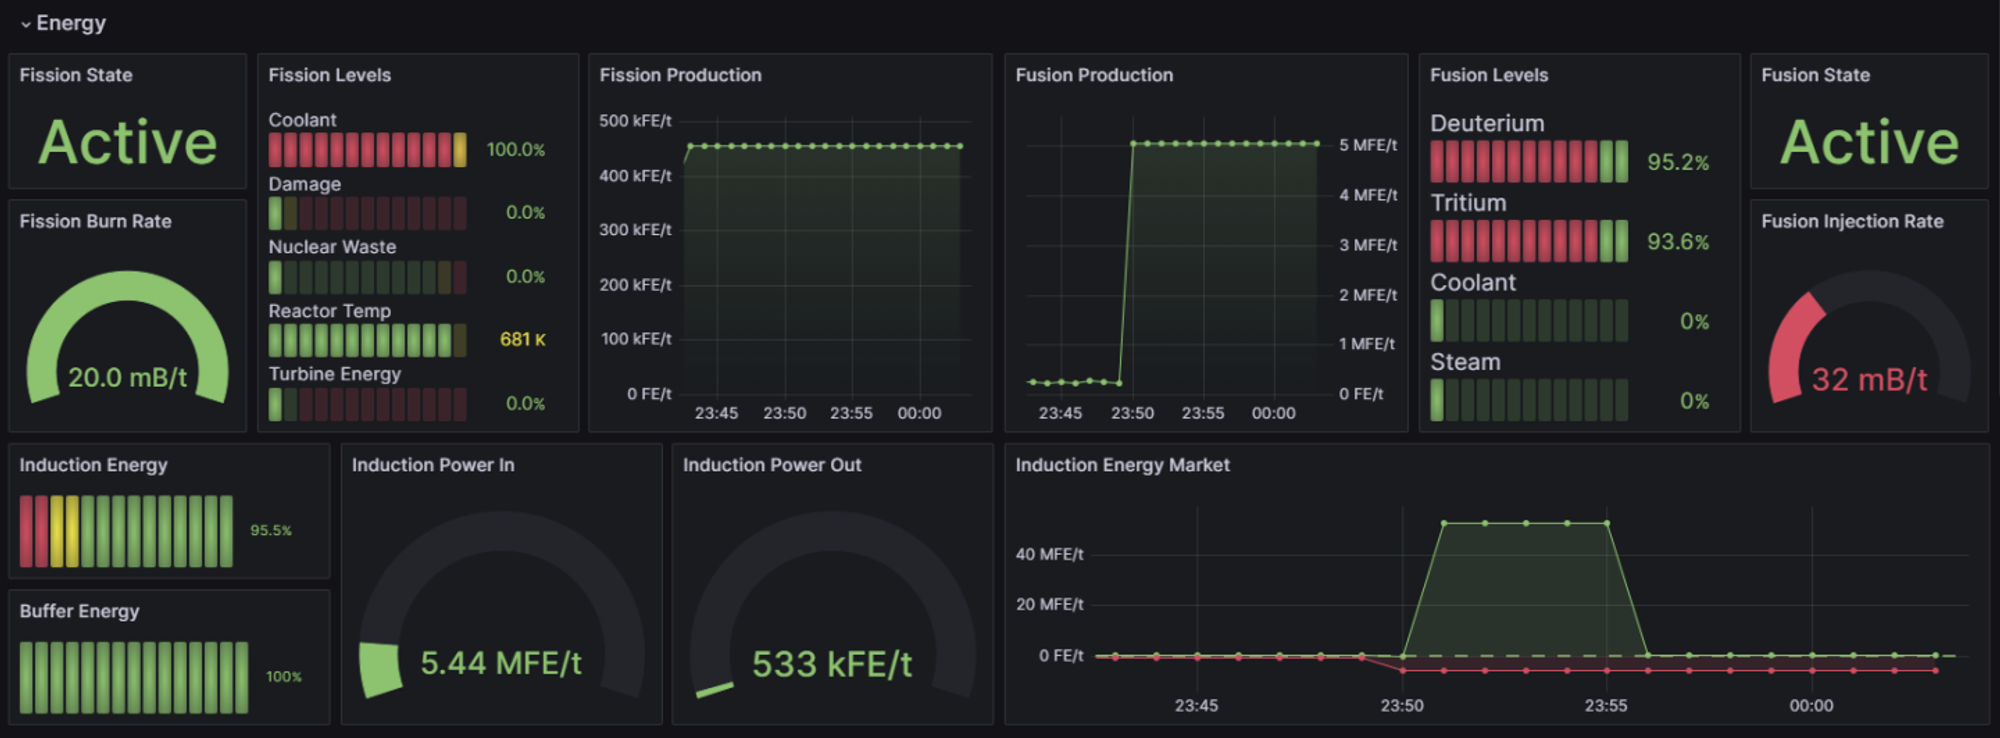
Once you have connected Telem to your Grafana instance, you can import these dashboard samples as a starting point for your own designs.
Mekanism Fission/Fusion (Grafana Cloud using Prometheus)

Tips
- Use
si: itemsas a Custom Unit to enable SI prefixes on item counts (k items, M items, etc.).